Status
This indicator is no longer updated
Updates to the WICH are paused pending the results of a review of the content and presentation of data within the tool. The tool has not been updated since the 16 March 2023. Please send any questions or comments to PHA-OHID@dhsc.gov.uk
The Wider Impacts of COVID-19 on Health (WICH) monitoring tool is designed to allow you to explore the indirect effects of the COVID-19 pandemic on the population's health and wellbeing. WICH presents a range of health and wellbeing metrics in interactive plots that can be broken down to show differences between groups - for example, you can explore grocery purchasing habits by region or social class. WICH is updated quarterly and may include the addition of new metrics as they become available. A summary has been included for WICH and is available to read.
The WICH tool is currently being redeveloped so that it continues to be a responsive resource which meets the needs of its users for the recovery phase of the COVID-19 pandemic. Specifically, in response to an evaluation conducted in 2021, the indicator themes are being restructured so that they are consistent with a WHO pandemic framework. This framework consists of five main pathways through which the pandemic and related containment measures can have an impact on population health. The first two themes are included in the December 2022 update: Impact of COVID measures, Impact on healthcare. Please see the table below to find out which metrics have been grouped into these new themes.
Office for Health Improvement and Disparities (OHID) Health Intelligence teams have collated a range of metrics and grouped them into nine themes. Click the rows in the table below to expand groups and subgroups. The link column will take you to the relevant theme within the tool. You can search through metrics using the search bar on the right.
Updated 16/03/2023.
A list of all indicators, including those that are new or updated in this release.
Revisions to metrics are recorded in the change log, available to download.
On the 5 November 2020, we published a report which provided an in-depth commentary on the impact of the COVID-19 pandemic on grocery shopping behaviours during March to June 2020.
We are interested in your feedback on the tool. If you have any comments or suggested changes, please email PHA-OHID@dhsc.gov.uk.
This Office for Health Improvement and Disparities (OHID) monitoring tool looks at the wider impacts of the coronavirus (COVID-19) pandemic on population health. This report briefly highlights the main findings.
This resource is updated quarterly, with new data for existing metrics and new metrics covering relevant themes added when data become available. In some cases, a metric is from a single time point data collection and therefore figures will not be updated. This will be continually reviewed and the resource will be updated as appropriate for relevance and timeliness.
This summary provides the main messages for some of the metrics updated in this release. It will cover employment indicators, such as number of job vacancies and redundancy rates, child physical activity, wellbeing and breast screening.
There is a strong evidence base showing that work is generally good for physical and mental health and wellbeing. Figure 1 shows the number of job vacancies has continued to decrease to 1,134,000 for the quarter November 2022 to January 2023, from a recent peak of 1,294,000 in the quarter February to April 2022.
Figure 1: Quarterly average of number of job vacancies in the UK (thousands) (seasonally adjusted), United Kingdom, November 2018 to January 2023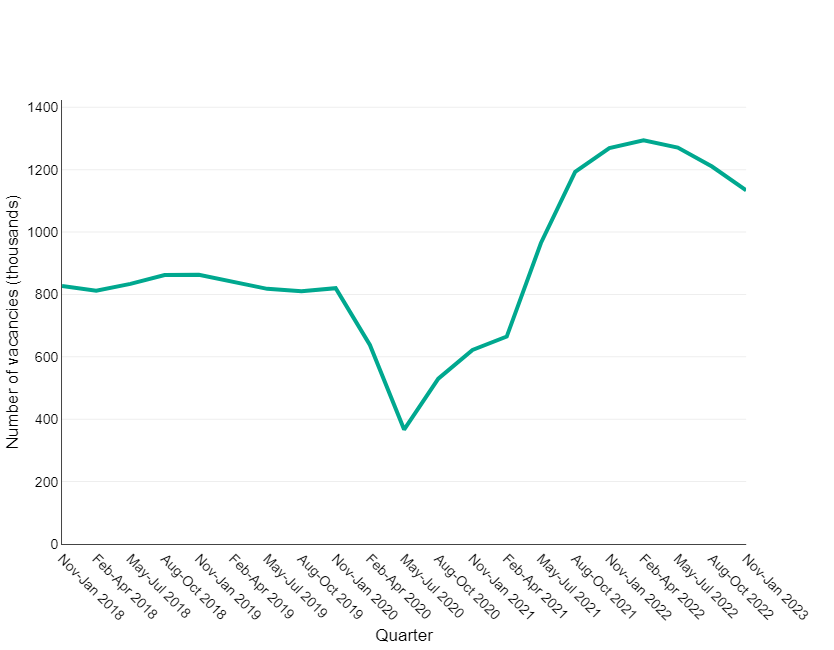
Source: Vacancy Survey, Office for National Statistics
Figure 2 shows the redundancy rate for all persons has continued to increase to 3.5 per 1,000 employees for the quarter October to December 2022, from 1.9 for the quarter April to June 2022. This remains below levels from a peak during the pandemic where the redundancy rate reached 12.8 per 1,000 employees for the quarter October to December 2020.
For the same period a larger increase in redundancy rate is observed for males. For the quarter October to December 2022 the redundancy rate reached 4.5 per 1,000 employees, an increase from 2.1 for the quarter April to June 2022. This figure is below the redundancy rate at the peak of the pandemic (14.7 per 1,000 employees for the quarter October to December 2020).
Figure 2: The ratio of redundancy level to the number of employees by sex, January 2018 to December 2022, England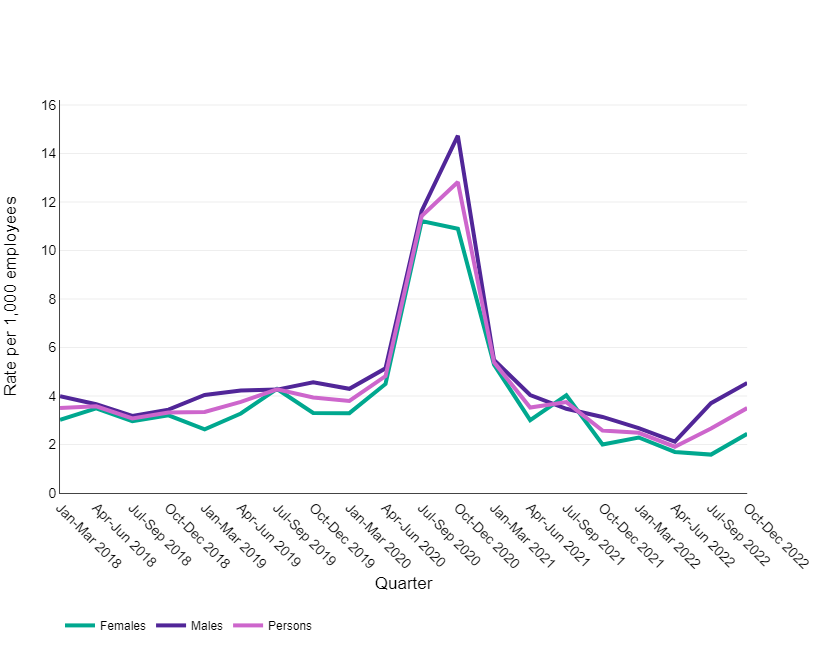
Source: Labour Force Survey, Office for National Statistics
This data enables us to explore whether the pandemic has had an impact on the percentage of people experiencing low levels of life satisfaction.
Figure 3 shows the percentage of respondents with a low life satisfaction score. This percentage has been increasing since December 2021. The November 2022 figure (10.3%) was higher than both the 2019 baseline (5.7%) and October 2021 (8.4%). However, it was 0.1 percentage points lower than the November 2020 (10.4%) when the second lockdown came into force in England.
Figure 3: The percentage of survey respondents with low life satisfaction (score 0-4) in England, June 2020 to November 2022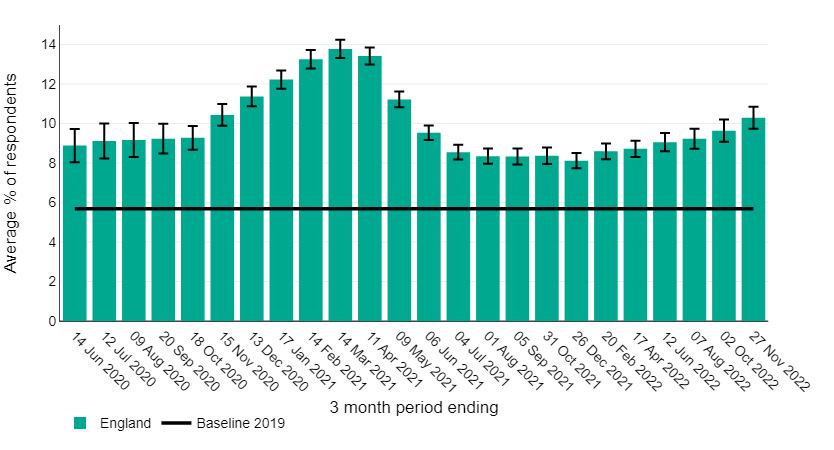
Source: PHE/OHID analysis of Opinions and Lifestyle Survey data from Office for National Statistics
Figure 4 shows that for all three school terms of the 2021 to 2022 academic year the percentage of physically active children (aged 5 to 16 years) was higher than the respective terms of the 2020 to 2021 academic year and have returned to pre-pandemic levels. The UK Chief Medical Officers (CMO) currently recommend that children and young people (5 to 18 years) are physically active for an average of at least 60 minutes per day across the week.
Figure 4: Percentage of children and young people aged 5-16 years that met the UK Chief Medical Officers' recommendations for physical activity, England, Autumn 2018 to Summer 2022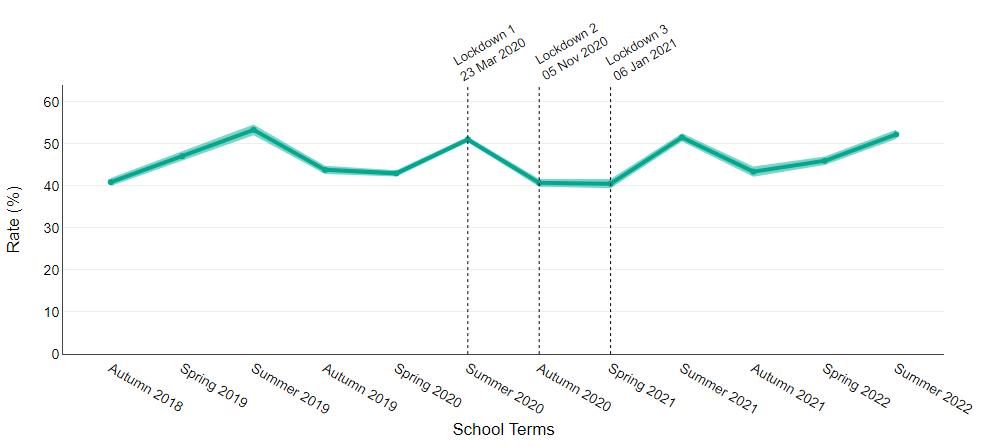
Source: Active Lives Children and Young People Survey, Sport England
Breast screening is offered to women aged 50 to 71 years of age every 3 years to maximise the chances of finding breast cancers at an early stage when they are too small to see or feel. This indicator aims to show the restoration of breast screening services following a pause in invitations between April and June 2020.
Figure 5 shows the proportion of women aged 50 to 73 years who were offered a subsequent appointment for breast screening within 36 months of their last attended appointment or date of first offered appointment for women who did not attend. The proportion has continued to increase to 54.3% in Quarter 1 2022/23, from 45.7% in Quarter 4 of 2021/22. Breast cancer screening services have been negatively affected by the COVID-19 pandemic and this proportion remains below pre-pandemic levels of 81.8% (Quarter 4 2019/20) and below the ‘acceptable level’ for this standard 90% and over.
Figure 5: Proportion of women eligible for breast screening whose date of first offered appointment is less than or equal to 36 months of their previous episode, England, Q2 2017/18 to Q1 2022/23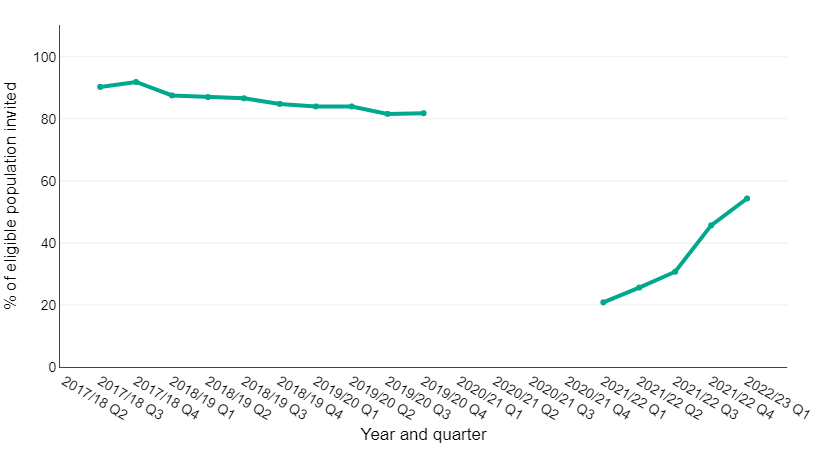
Gap in line indicates where data have been withdrawn due to poor data quality during the pandemic and the change in the IT reporting system.
Source: Screening key performance indicators, NHS England and NHS Improvement
This indicator shows the proportion of women offered screening who have a technically adequate screen within 6 months of the date of first offered appointment. As shown in figure 6 the proportion has remained stable at 55.5% for Quarter 1 2022/23, compared to 53.3% in Quarter 4 2021/22. This proportion remains below the ‘acceptable level’ of 70%.
Figure 6: Proportion of women eligible for breast screening who have a technically adequate screen less than or equal to 6 months of date of first offered appointment, England, Q2 2017/18 to Q1 2022/23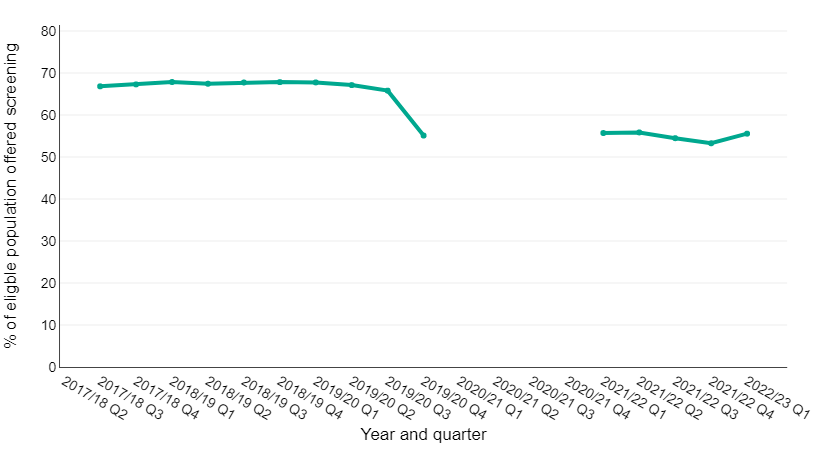
Gap in line indicates where data have been withdrawn due to poor data quality during the pandemic and the change in the IT reporting system.
Source: Screening key performance indicators, NHS England and NHS Improvement
If you are interested in a summary from an earlier release, please email PHA-OHID@dhsc.gov.uk.
| Month | 2020 | 2021 |
|---|---|---|
| January | 6 Jan - third national lockdown | |
| February | 15 Feb - hotel quarantine for travellers arriving in England from 33 high-risk countries | |
| March | 20 Mar - schools close, all cafes, pubs and restaurants close except for take-away 23 Mar - first national lockdown begins 'stay at home' |
8 Mar - schools, colleges and practical university courses open 29 Mar outdoor gatherings of either 6 people or 2 households allowed. Outdoor sports facilities reopen. Stay at home rule ends |
| April | 12 Apr - non-essential retail, personal care premises (e.g. hairdressers), public buildings, gyms and outdoor hospitality reopen | |
| May | 13 May - outdoor exervise with one other houeshold allowed | 17 May - outdoor gatherings of up to 30 people allowed. Indoor rule of 6 or 2 households applies (social distancing to remain). Indoor locations such as cinemas, play centres and hotels to reopen |
| June | 1 Jun - fatherings of up to 6 people outdoors and phased reopening of schools 15 Jun - non-essential retail and secondary schools reopen 23 Jun - 2m social distancing rule relaxed |
21 Jun - wedding guests no longer limited to 30, care home residents do not necessarily have to self-isolate if they go on a trip out of the home, children can go on overnight trips in groups of 30, large events pilots continue. Those in areas with high levels of Delta variant advised to meet outside, keep 2m apart from those you don't live or bubble with, minimise travel in/out of the area |
| July | 4 Jul - pubs, restauraunts, hotels and hairdressers open. Two households can meet indoors and social distancing relaxed to at least one metre | 19 Jul - all legal limits on social contact removed |
| August | 14 Aug - indoor activities such as theatres, bowling alleys and soft play, resume | |
| September | 14 Sep - indoor and outdoor social gatherings of more than 6 banned 22 Sep - return to working from home and hospitality curfew of 10pm |
|
| October | 14 Oct - 3 tier system of restrictions introduced | |
| November | 5 Nov - second national lockdown | |
| December | 2 Dec - second lockdown ends, return to 3 tier system 21 Dec - tier 4 alert introduced (stay at home) 26 Dec - more areas enter tier 4 |
Use the tabs at the top of the screen to move between the different metric groups.
Each tab provides a visualisation of the selected metric by different breakdowns and the trends over time for the metrics available.
This accessibility statement applies to https://analytics.phe.gov.uk/apps/covid-19-indirect-effects/
This website is run by Public Health England. We want as many people as possible to be able to use this website. For example, that means you should be able to:
• change colours, contrast levels and fonts
• navigate most of the website using just a keyboard
• navigate most of the website using speech recognition software
• listen to most of the website using a screen reader (including the most recent versions of JAWS, NVDA and VoiceOver)
We’ve also made the website text as simple as possible to understand.
AbilityNet has advice on making your device easier to use if you have a disability.
We know some parts of this website are not fully accessible:
• The graphs and charts may not be usable if you rely on the keyboard, struggle with colors, or use a screenreader. The data tables associated with each should be more usable.
• Not all the text will be available when you zoom in.
• Some text and graphics do not have sufficient contrast.
• You cannot skip to the main content when using a screen reader, and most pages are missing landmarks.
• Some page updates (when searching or filtering) do not announce the updates to screenreaders.
If you need information on this website in a different format like accessible PDF, large print, easy read, audio recording or braille, please email PHA-OHID@dhsc.gov.uk.
We’ll consider your request and get back to you in 5 working days.
We’re always looking to improve the accessibility of this website. If you find any problems not listed on this page or think we’re not meeting accessibility requirements, please email PHA-OHID@dhsc.gov.uk.
The Equality and Human Rights Commission (EHRC) is responsible for enforcing the Public Sector Bodies (Websites and Mobile Applications) (No. 2) Accessibility Regulations 2018 (the ‘accessibility regulations’). If you’re not happy with how we respond to your complaint, contact the Equality Advisory and Support Service (EASS).
Public Health England is committed to making its website accessible, in accordance with the Public Sector Bodies (Websites and Mobile Applications) (No. 2) Accessibility Regulations 2018.
This website is partially compliant with the Web Content Accessibility Guidelines version 2.1 AA standard, due to the non-compliances listed below.
The content listed below is non-accessible for the following reasons.
• Graph controls could not be accessed with a keyboard alone
• A feature to skip over the navigation and filters to go directly to the main content was not provided
• It is not possible to dismiss content on the navigation bar that appears on-hover with keyboard only
• A number of icons and images were missing alternative text
• Content was lost when the page is zoomed in up to 400% and scrolling occurred in both directions
• The colour contrast of text and the graph controls was insufficient
• ARIA landmarks such as main and banner were missing
• The language of the page had not been set
• The current page state is visually communicated but not programmatically communicated
• Important changes in content that occur dynamically are not announced to screen reader users
• Lists were not used to group contents in some areas
• HTML was not nested according to the specification
• The graphs require colour vision to interpret, failing Use of Color
• Icons used in the graphs, and some colour combinations fail Non-Text Contrast
• The keyboard controls are not Keyboard accessible
• The graphs do not have alt-text, failing Non-Text Content
• The text within the graphs are not structured, failing Info and Relationships
Most of the issues above will be reviewed with the development team and be resolved within 6 months.
The graphs are created using a library, and it has not been possible to find an accessible alternative. The data tables associated with each graph will be updated to ensure they include the same information as the graph.
This statement was prepared on 23rd September 2021. It was last reviewed on 23rd September.
This website was last tested on 22nd September 2021. The test was carried out by Nomensa. A selection of 10 pages across the site were selected for testing, covering the main templates and types of content (graphs) that are available.
This indicator is no longer updated
This indicator is active
This indicator is no longer updated
Update status not found
This indicator is no longer updated
This indicator is active
This indicator is no longer updated
Update status not found
The COVID-19 Health Inequalities Monitoring for England (CHIME) tool brings together data relating to the direct impacts of COVID-19, such as on mortality rates and hospital admissions.
By presenting inequality breakdowns, including by age, sex, ethnic group, level of deprivation and region, the tool provides a single point of access to: